
IRS Data & Studies
IRS Failure to File vs Failure to Pay Penalties: What the Data Shows (2026)
The short answer: IRS failure to file vs failure to pay penalties differ tenfold — failure-to-file accrues at 5%/month of unpaid tax, failure-to-pay at 0.5%/month. In FY2023 the IRS assessed $20.7 billion in failure-to-file penalties on individuals, averaging roughly $6,280 each, versus $14.9 billion in failure-to-pay penalties averaging about $800.
You and your spouse are looking at a notice — or an account transcript — with two separate penalty lines stacked on the same balance, and it isn't obvious which one is doing the damage. It matters, because one of them grows ten times faster than the other. The IRS's own Data Book shows exactly how these two penalties play out across millions of taxpayers, and the numbers point to one clear move you can make today.
⏱ The real clock: there is no single response deadline here — both penalties compound monthly. Failure-to-file adds 5% of your unpaid tax every month it runs; failure-to-pay adds 0.5%. Filing today, even with no payment attached, cuts your monthly penalty rate by ninety percent.

IRS failure to file vs failure to pay penalties: the rates side by side
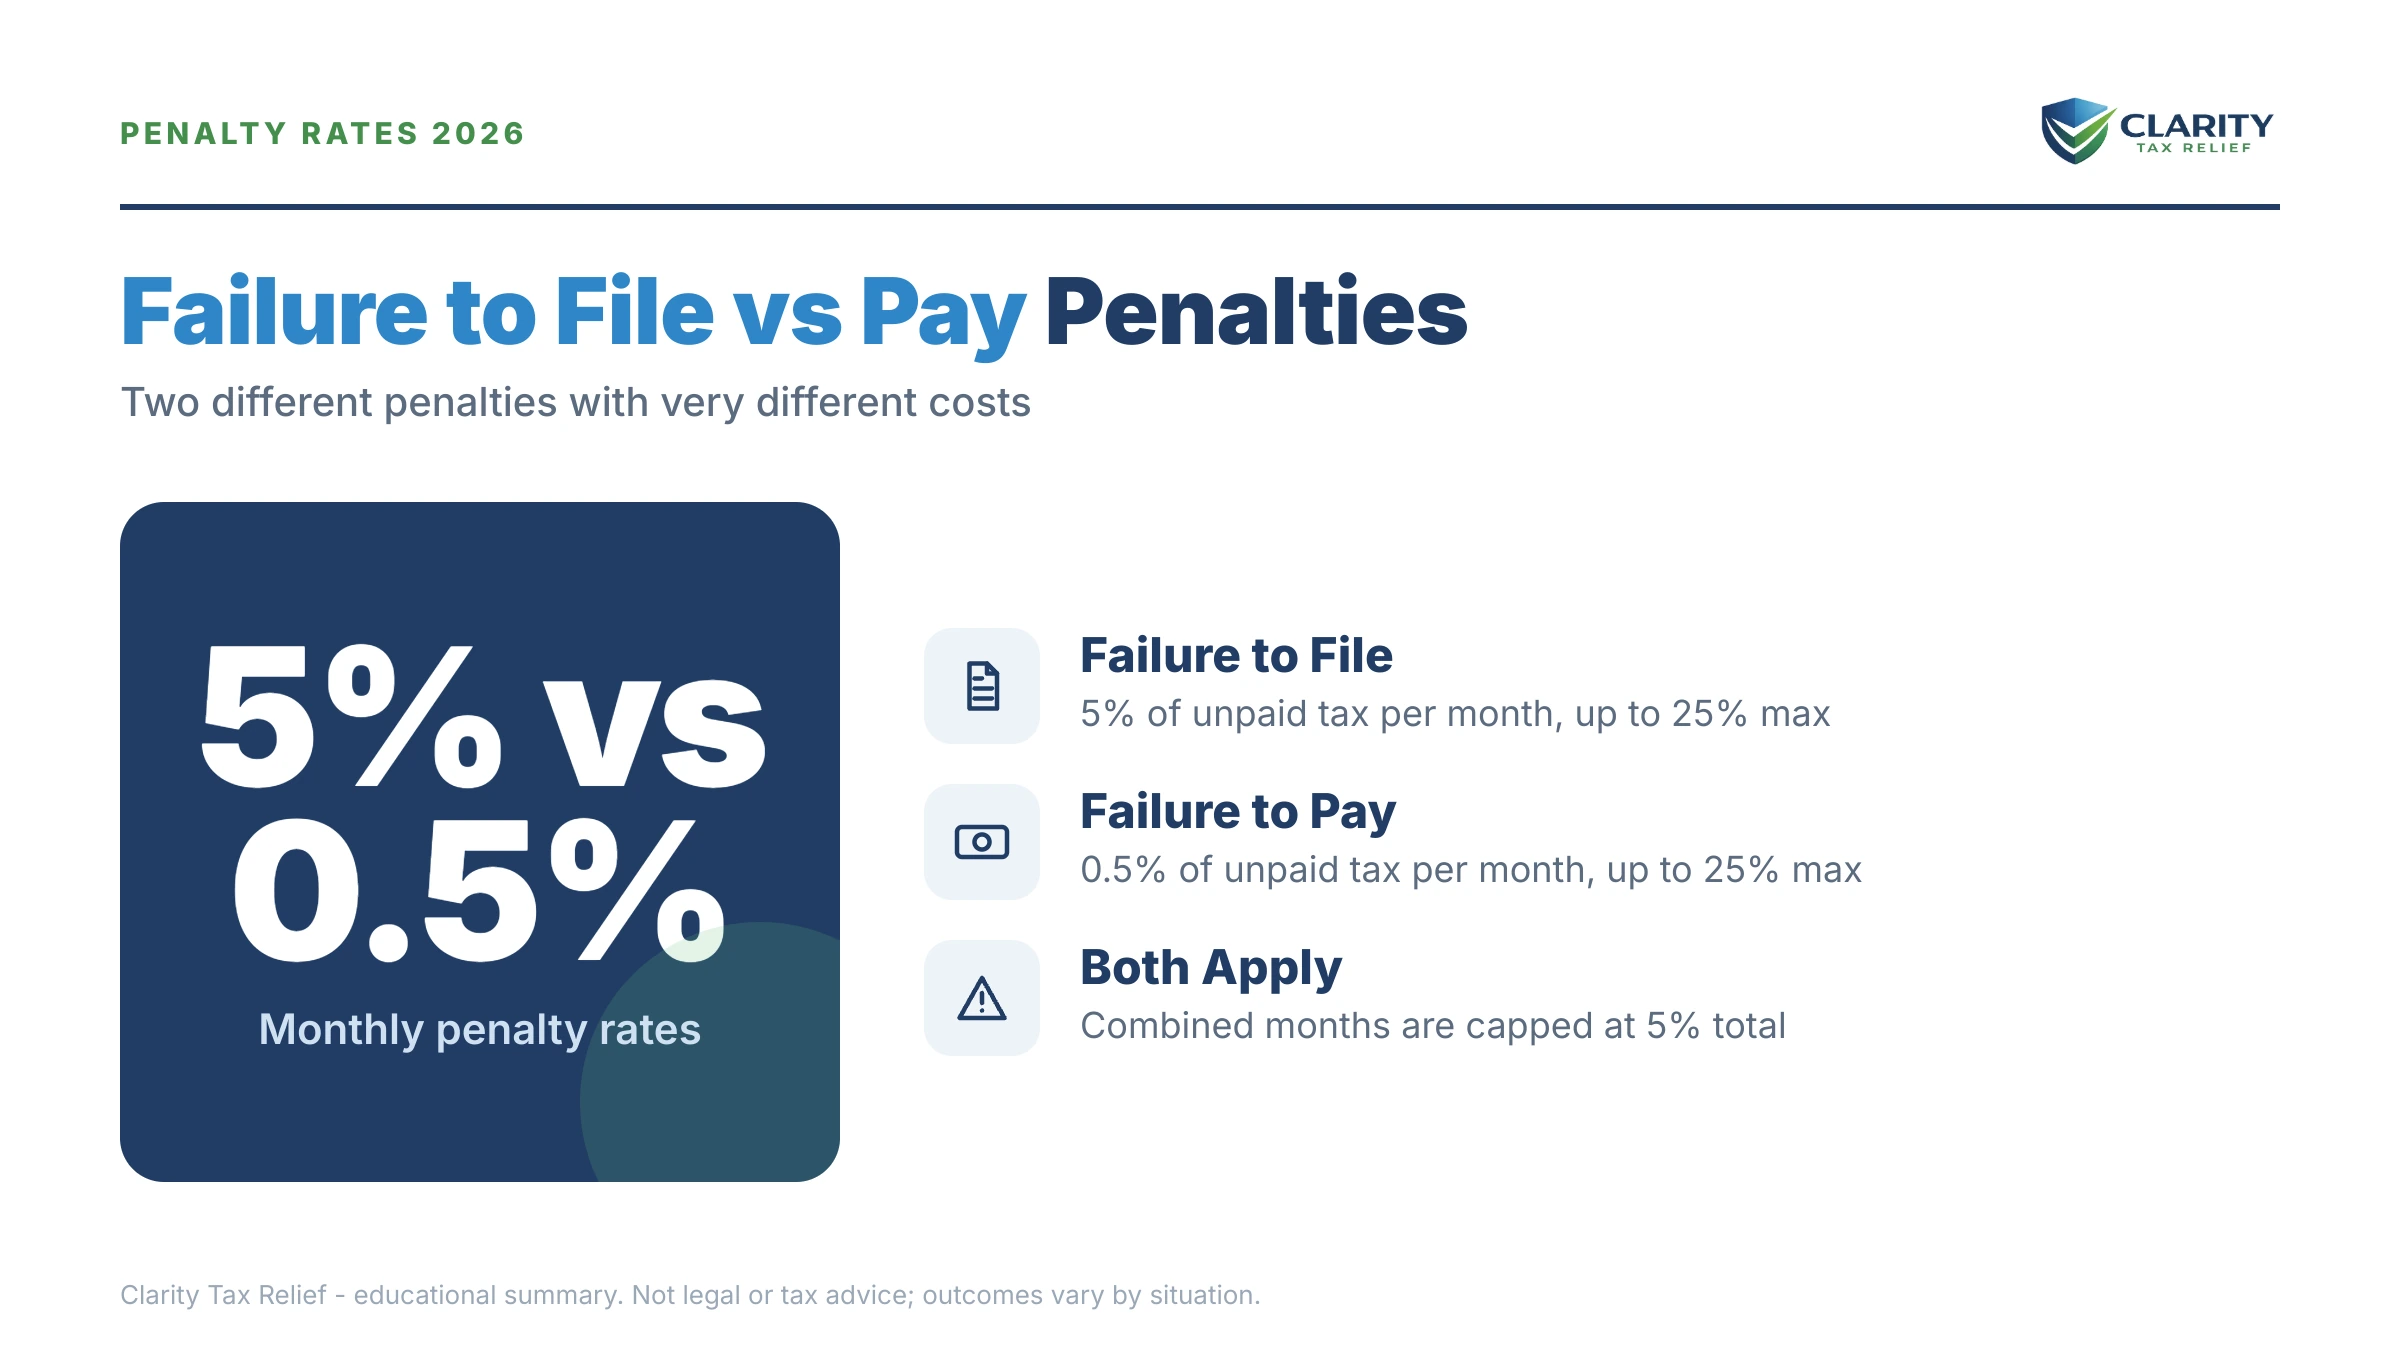
The failure-to-file penalty charges 5% of your unpaid tax per month; the failure-to-pay penalty charges 0.5% per month — the same debt, ten times the monthly cost.
Both penalties are calculated only on tax you haven't paid, both cap at 25% of that unpaid tax, and both can run at the same time. When they overlap, the IRS reduces the failure-to-file rate to 4.5% so the combined monthly charge is 5%, not 5.5%. For the plain-English walkthrough of how each one hits your bill, see our guide to the failure to file penalty vs failure to pay — this page is the data study behind it.
| Rule | Failure to file | Failure to pay |
|---|---|---|
| Monthly rate | 5% of unpaid tax (4.5% in months both apply) | 0.5% of unpaid tax (0.25% on an approved installment agreement) |
| Maximum | 25% of unpaid tax | 25% of unpaid tax (about 50 months to reach) |
| Average penalty, FY2023 | Roughly $6,280 | About $800 |
| What triggers it | Return filed after the deadline (or extended deadline) with tax unpaid | Tax not paid by the original April due date |
| How to stop the clock | File the return — even with zero payment | Pay the balance, or slow it with a payment plan |
Two edge cases worth knowing. First, if your return is more than 60 days late with a balance due, a minimum failure-to-file penalty applies — a flat floor the IRS adjusts annually for inflation — so even small balances get stung. Second, if you're owed a refund, neither penalty applies, because there's no unpaid tax to calculate against. The trap catches people who assume they owe nothing, skip filing, and turn out to be wrong — which is why the answer to should I file if I can't pay is always yes.
“If both a failure to pay and a failure to file penalty are applied in the same month, the failure to file penalty will be reduced by the amount of the failure to pay penalty applied in that month.”
— Failure to Pay Penalty (IRS.gov)
What the IRS Data Book shows for FY2023 and FY2025
The IRS hit individuals with $14.9 billion in failure-to-pay penalties across 18.6 million penalty assessments in FY2023 — and the far harsher failure-to-file (delinquency) penalty added another $20.7 billion.
Look at the asymmetry hiding in those totals. The FY2023 Data Book (Table 28) counts 18,599,109 failure-to-pay penalties worth $14,874,227 thousand ($14.87 billion) against individual, estate, and trust taxpayers — but only 3,292,863 delinquency penalties worth $20,678,979 thousand ($20.68 billion). Far fewer people got hit with the failure-to-file penalty, yet it cost them more in total. Failure-to-file averaged roughly $6,280 per penalty vs about $800 per failure-to-pay penalty in FY2023 — the direct result of the 5%/month vs 0.5%/month rate gap. The image below shows exactly how lopsided the comparison looks at a glance.
| Penalty and fiscal year | Number assessed | Dollars assessed |
|---|---|---|
| Failure to pay — FY2023 | 18,599,109 | $14,874,227 thousand ($14.87 billion) |
| Failure to file (delinquency) — FY2023 | 3,292,863 | $20,678,979 thousand ($20.68 billion) |
| Failure to pay — FY2025 | 24,251,980 | $12.09 billion |
| Failure to file (delinquency) — FY2025 | — | $6.48 billion |
The trend since then is striking. By FY2025 individual failure-to-pay penalties reached 24,251,980 penalties worth $12.09 billion, while individual delinquency penalties were $6.48 billion (IRS Data Book FY2025 Table 4-2). More people are getting hit with the slow-burn penalty for balances they filed but couldn't pay — a pattern we break down further in our study of IRS failure to pay penalty statistics. Delinquency dollars, by contrast, swing with enforcement activity against non-filers, which lands in uneven batches rather than a steady stream.
What the rate gap costs a real household: a worked example
Filing five months late instead of paying five months late multiplies your penalty by ten on the identical balance.
Say you and your spouse owe $10,000 on a joint return. This is hypothetical, but the arithmetic is exactly how the IRS computes it:
- You file on time but pay 5 months late: failure-to-pay only, at 0.5% × 5 months = 2.5%. Penalty: $250, plus interest.
- You file 5 months late and haven't paid: failure-to-file at 4.5% × 5 months = $2,250, plus failure-to-pay at 0.5% × 5 months = $250. Penalty: $2,500, plus interest — and the failure-to-pay portion keeps running every month after that.
Left alone long enough, the combined worst case is 47.5% of the unpaid tax — 22.5% for late filing plus the full 25% for late payment — which would turn that $10,000 into $14,750 before a dollar of interest. And interest never caps; it compounds daily at the rate covered in our guide to IRS interest rates 2026. You can estimate your own combined total with our Penalty & Interest Calculator.
One note for married couples: on a joint return, both spouses are jointly liable for the tax, the penalties, and the interest — the IRS can collect the whole amount from either of you. An extension changes only half the picture: it protects you from the failure-to-file penalty if you file by the extended deadline, but the failure-to-pay penalty still runs from the original April due date on anything unpaid.
What happens if you ignore both penalties
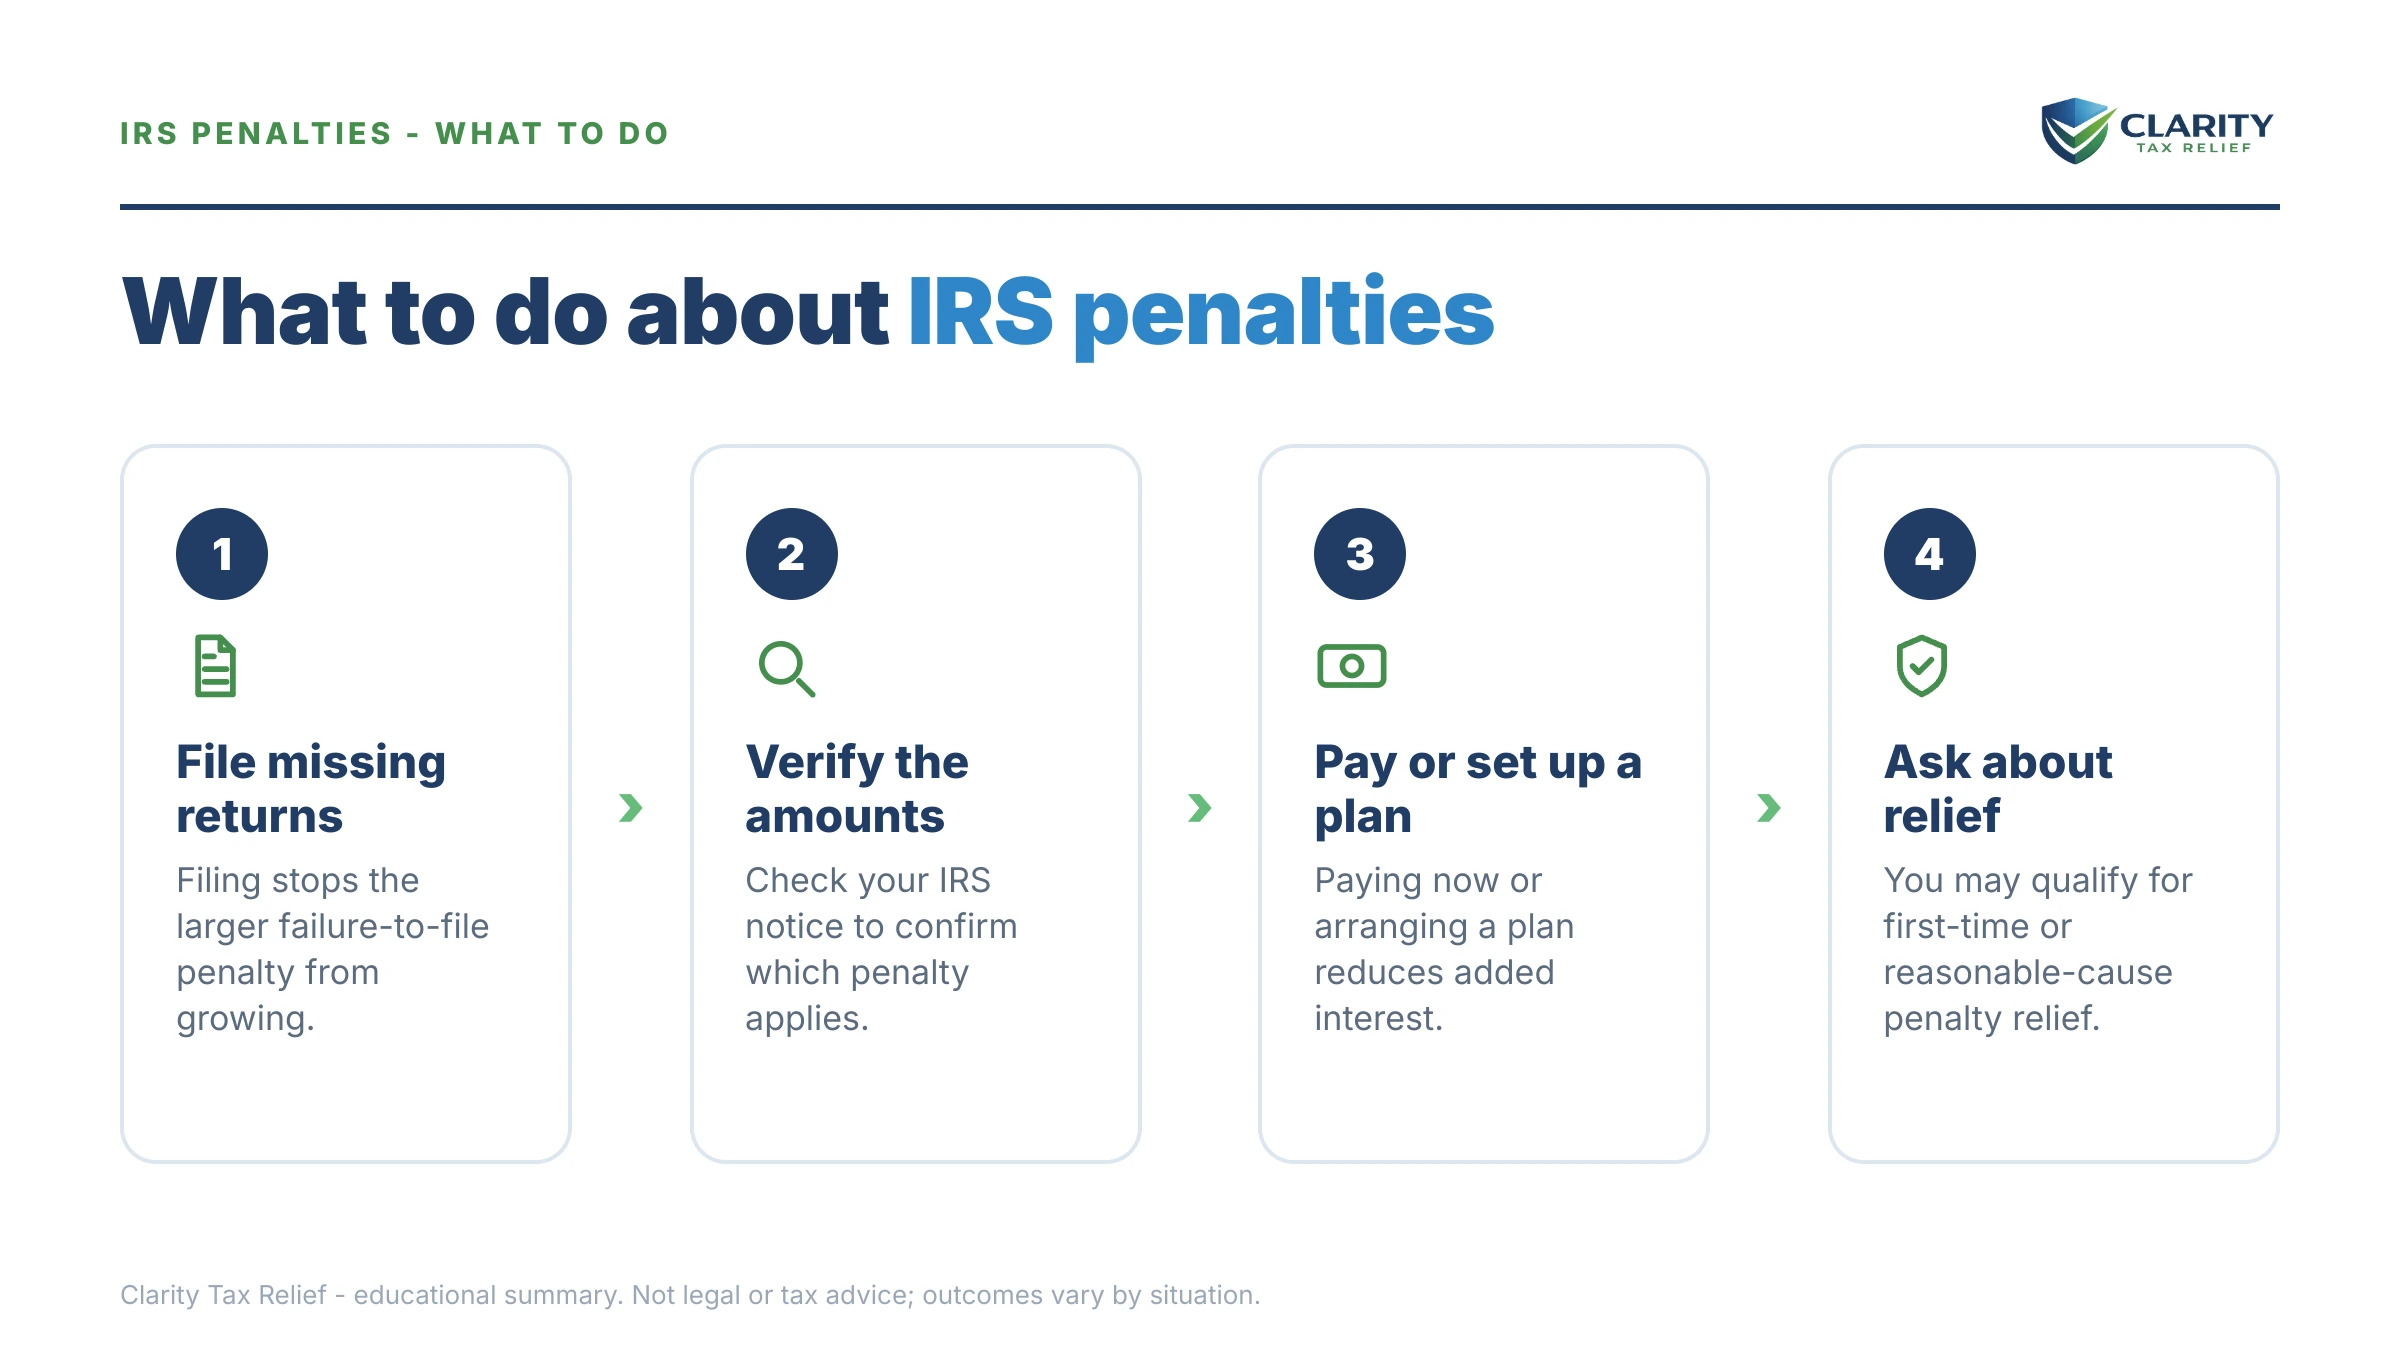
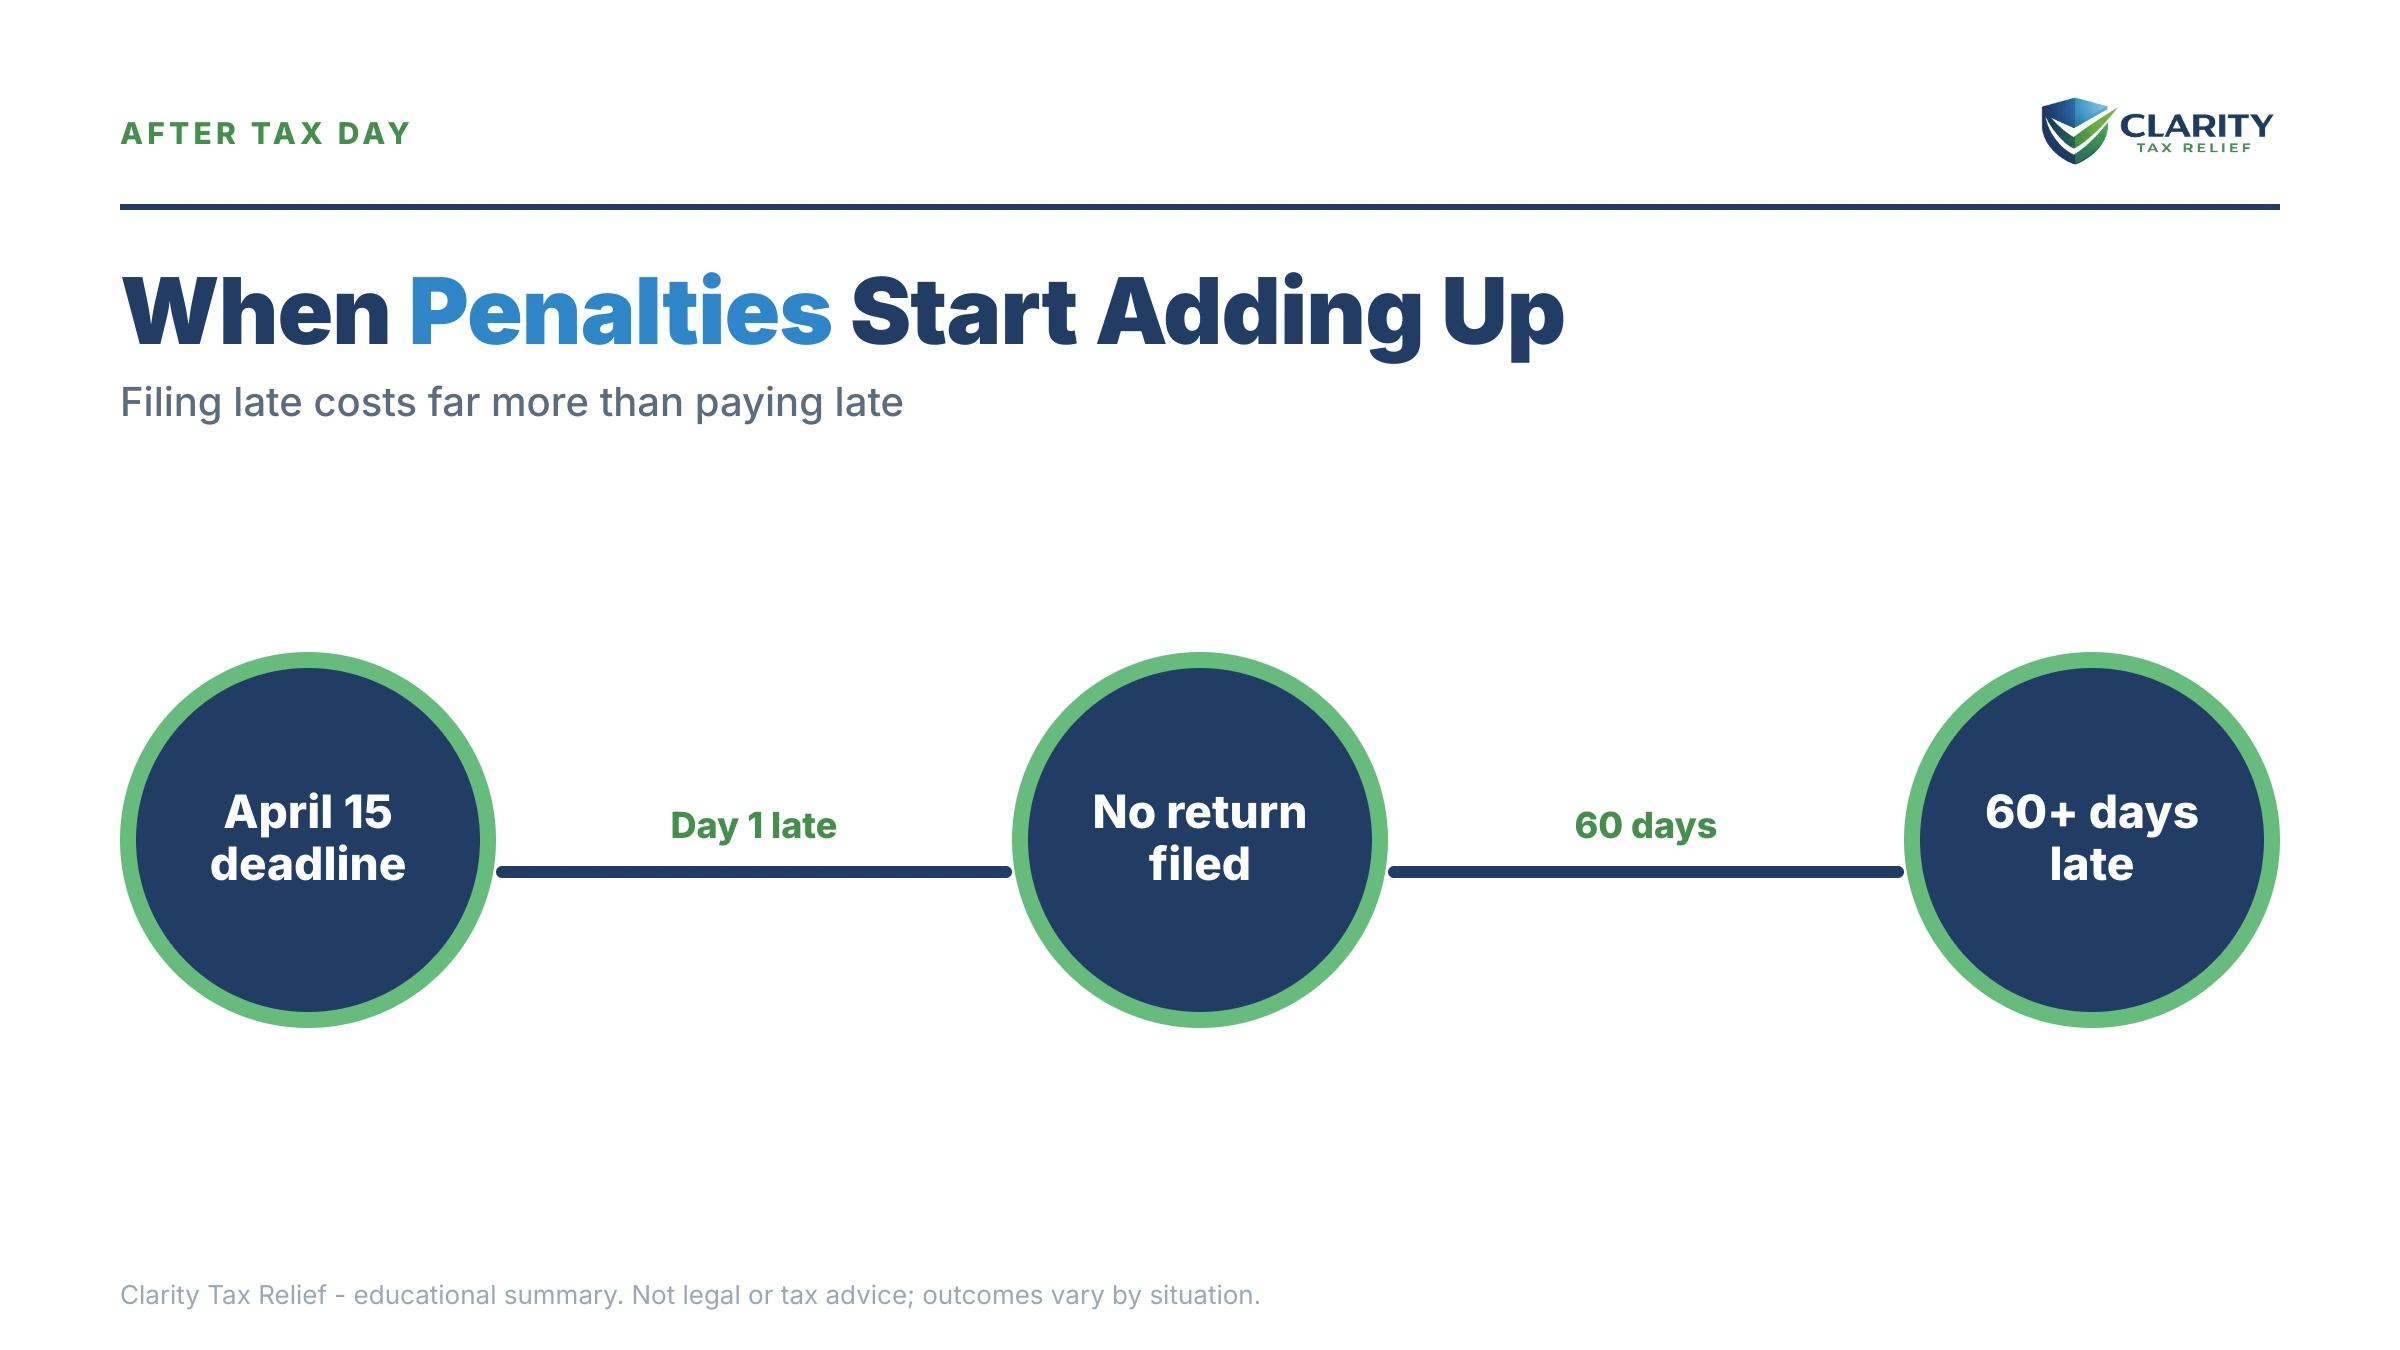
Penalties are the first stage of an automated sequence that ends in enforced collection — the balance doesn't freeze while you decide what to do.
- Months 1–5 (unfiled and unpaid): the combined penalties accrue at 5% per month until the failure-to-file portion maxes out. In five months you've added 25% to the debt.
- The bill arrives: once the balance is assessed, a CP14 notice shows the tax, penalties, and interest as separate line items and starts the collection sequence.
- Reminders: CP501 and CP503 follow if the CP14 goes unanswered — still just bills, but the failure-to-pay penalty and interest post to your account every month.
- Intent to levy: a CP504 lets the IRS take your state tax refund, and a federal tax lien becomes a live possibility.
- Final notice: an LT11 or Letter 1058 starts a 30-day clock, after which the IRS can garnish wages and levy bank accounts.
- The slow burn continues: failure-to-pay keeps adding 0.5% monthly until it hits its 25% cap around month 50 — and interest never caps, compounding on the tax and the penalties alike.
Penalties posting to your account every month?
Send us your notice or transcript. An experienced tax professional will break down exactly which penalties you're carrying, which ones you may realistically get removed, and how to stop the monthly accrual — free, confidential, no pressure.
How to get these penalties removed: your options
In FY2023 alone, individual failure-to-pay abatements totaled 2,418,745 penalties / $1.14 billion removed — penalty relief is a routine, working part of the system, not a long shot.
The full abatement picture — how often the IRS grants relief across every penalty type — is in our companion study on how often does the IRS remove or abate penalties. For these two penalties specifically, four paths matter:
| Option | Cost | Typical timeline | Best for |
|---|---|---|---|
| First time penalty abatement | Free | Often resolved in one phone call; written requests take longer | Clean compliance history for the prior 3 years |
| Automatic Exemption from Penalty (AEP) | Free — no request needed | Applied automatically, starting summer 2026 | Taxpayers who would have qualified for First-Time Abate |
| Reasonable cause penalty abatement | Free to request via Form 843 | Typically several weeks to months for a decision | Illness, disaster, death in the family, or other events beyond your control |
| Installment agreement (rate reduction) | $0 setup for short-term plans; fees vary for longer plans | Can be set up online the same day for most balances under $50,000 | Cutting the ongoing failure-to-pay rate from 0.5% to 0.25% per month |
Two things the table can't capture. First, timing: FTA is being replaced by the Automatic Exemption from Penalty starting summer 2026, so if you're reading this after that rollout, some relief may already be on your account — check your transcript before you write a letter. Second, scope: abatement removes penalties, not the underlying tax, and interest charged on an abated penalty comes off with it, but interest on the tax itself stays. For where these two penalties fit in the broader penalty landscape and current amounts, see our hub on how much are IRS penalties on back taxes.
How to respond, step by step
- File any unfiled returns today. Filing stops the 5%/month failure-to-file clock immediately, even if you send no payment. Every month an unfiled return sits, it costs ten times what late payment does.
- Pay whatever you can toward the balance. Both penalties are percentages of the unpaid tax, so every dollar you pay shrinks every future month's penalty. Pay online at IRS.gov/payments.
- Set up a payment arrangement. An approved installment agreement cuts the failure-to-pay rate from 0.5% to 0.25% per month and stops the collection notice sequence.
- Request penalty abatement. If your prior three years were clean, ask for First-Time Abate. Otherwise document reasonable cause and file Form 843.
- Get a professional review if multiple years are involved. The order you fix things — returns first, then penalties, then the balance — changes what you ultimately pay. An experienced tax professional can sequence it correctly.
When you can handle this yourself
Most single-year penalty situations don't need professional help. If you have one late year, you agree with the IRS's numbers, your prior three years were clean, and the balance fits an online payment plan, you can file, set up the plan, and request First-Time Abate in one phone call — all yourself, at no cost beyond the tax.
Experienced help changes outcomes in a narrower set of situations: multiple unfiled years (especially if the IRS has already filed substitute returns that overstate what you owe), balances too large for streamlined online agreements, reasonable-cause cases that live or die on how the evidence is documented, and business or payroll penalties, which follow different rules entirely. In those cases, the sequencing — which year to file first, which penalty to challenge, which agreement to request — is where money is won or lost.
Terms on your notice, decoded
- Delinquency penalty — the IRS Data Book's formal name for the failure-to-file penalty; "delinquent" describes the return, not you.
- Assessed vs. abated — "assessed" means the penalty was charged to your account; "abated" means the IRS later removed it, in full or in part.
- Transaction codes 166 and 276 — the transcript codes where the failure-to-file and failure-to-pay penalties post, respectively.
- Combined-month offset — in months both penalties run, failure-to-file drops to 4.5% so the combined charge is 5% per month, not 5.5%.
- Minimum failure-to-file penalty — a flat floor amount, adjusted annually for inflation, that applies when a return with a balance due is more than 60 days late.
- First-Time Abate (FTA) — administrative penalty removal for taxpayers with a clean prior three years, being replaced by the Automatic Exemption from Penalty starting summer 2026.
Failure to file vs failure to pay: your questions, answered
Which is worse: failure to file or failure to pay?
Failure to file is far worse — it accrues at 5% of your unpaid tax per month versus 0.5% for failure to pay, a tenfold difference. In FY2023 the average individual failure-to-file penalty was roughly $6,280, while the average failure-to-pay penalty was about $800. That is why filing on time matters even when you can't send a dime with the return.
What is the IRS failure-to-file penalty rate in 2026?
The failure-to-file penalty is 5% of the unpaid tax for each month or part of a month your return is late, capped at 25% of the balance. If your return is more than 60 days late, a minimum penalty also applies — a flat amount the IRS adjusts annually for inflation. The penalty is calculated on unpaid tax only, so if you're owed a refund, there is no failure-to-file penalty.
What is the IRS failure-to-pay penalty rate?
The failure-to-pay penalty is 0.5% of the unpaid tax per month, also capped at 25%. It drops to 0.25% per month for any month an approved installment agreement is in effect, which is one of the quieter benefits of setting up a payment plan. Because it accrues so slowly, it takes about 50 months of nonpayment to hit the cap.
Do the failure-to-file and failure-to-pay penalties apply at the same time?
Yes, and the IRS coordinates them so you're not charged the full 5.5% combined. In any month both apply, the failure-to-file penalty is reduced to 4.5%, so the combined charge is 5% per month. The combined maximum is 47.5% of the unpaid tax — 22.5% for late filing plus 25% for late payment — and interest accrues on top of both.
Can failure-to-file and failure-to-pay penalties be removed?
Yes — the IRS abated 2,418,745 individual failure-to-pay penalties worth $1.14 billion in FY2023 alone. First-Time Abate applies if your prior three years were clean, reasonable cause covers illness, disaster, and similar events beyond your control, and starting summer 2026 the new Automatic Exemption from Penalty (AEP) grants some of this relief automatically, with no request needed.
Does filing an extension stop these penalties?
An extension stops the failure-to-file penalty as long as you file by the extended deadline — but it does not stop the failure-to-pay penalty. The tax itself is still due on the original April deadline, so any unpaid balance accrues the 0.5% monthly penalty plus interest from that date. Pay what you can with the extension request to shrink the base both penalties are calculated on.
Should I file my return if I can't pay anything?
Yes — always. Filing on time with zero payment means you face only the 0.5% monthly failure-to-pay penalty instead of the 5% monthly failure-to-file penalty, a tenfold savings every single month. Filing also starts the clocks that matter later: the audit statute, the 10-year collection statute, and eligibility for payment plans and settlement programs, none of which begin on an unfiled year.
Why did failure-to-file penalty totals fall from $20.68 billion in FY2023 to $6.48 billion by FY2025?
The penalty rules didn't change — the 5% monthly rate applies the same way in both years. Assessment totals swing year to year with IRS enforcement activity, particularly substitute-for-return assessments against non-filers, which generate large delinquency penalties in uneven batches. Meanwhile, failure-to-pay assessments rose from 18,599,109 penalties in FY2023 to 24,251,980 in FY2025 — more penalties overall, but fewer total dollars.
Your next 24 hours
- Find the penalty lines. On your notice or account transcript, locate the failure-to-file penalty (transaction code 166) and failure-to-pay penalty (code 276), and note the tax year and amounts for each.
- Gather three things: your last filed return, the notice itself, and income documents (W-2s, 1099s) for any year that's still unfiled.
- Get a free case review. Call (888) 825-7779 or use the 2-minute form at the top of this page. Both penalties post to your account monthly, so every month you wait adds to the balance a review could help you shrink.
Sources: penalty counts and dollar amounts in this study come from IRS Data Book Table 28, Civil Penalties Assessed and Abated, and the IRS Data Book FY2025 (Table 4-2). Current penalty rules are on the IRS's failure-to-file penalty page.
This guide is general information, not tax or legal advice for your specific situation. Eligibility for IRS programs depends on individual facts and circumstances; no outcome is guaranteed.